


It’s amazing to think it’s now been 15 years this month that LandlordMax was first incorporated and started selling software. We started programming it before the company was created, it took over a year to build the very first version, but the company itself was officially incorporated exactly 15 years ago this month! And right away within the first month people started to use the software was awesome.
With that in mind I think it’s a good time to take a walk down memory lane to see how LandlordMax has progressed over the years. For example the very first version was really only for individual real estate investors and as a result didn’t even have the concept of landlords or property owners. We made the decision at the time to exclude these so that we could release the software about half a year sooner then we could’ve otherwise. That and we wanted to start to get feedback right away. The ability to manage landlords was of course quickly added in the first major update of the software shortly after it’s initial release. We’ve come a long way since then!!
Website
But before we talk about the software I thought it might be interesting to view the website itself, especially since it’s pretty quick, and more important because it’s the first contact most people have with the company.
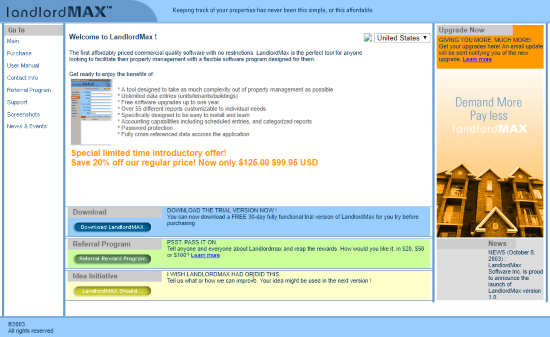
If you visited LandlordMax back in 2003 you would be presented with the above webpage. Well more or less, this is a screenshot from the WayBack Machine website so some images, the layout, etc. are not rendered correctly but it’s close enough to get a good feel for what it looked like back then. Keep in mind this is 2003, before the iPhone was even released, back when Windows XP was the brand new version of Windows, and Google was only founded 5 years before. All in all we’ve come a long way in 15 years.
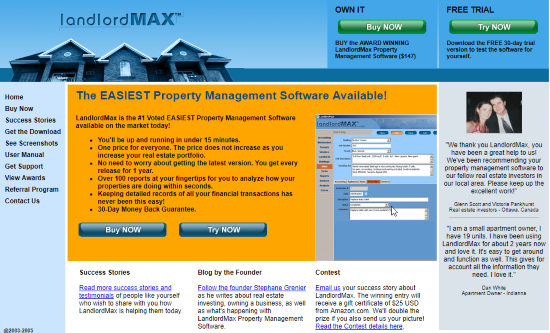
Sometime within the next couple years (late 2005) we changed our website to the above screenshot. That was a major re-designed and we kept it for about 5 years which is really good. It definitely served us well. This is also when I (the founder of LandlordMax) started my personal blog called FollowSteph.com where my initial post was about the website redesign of LandlordMax, and my second post was about the details of the redesign of the LandlordMax website (the how’s and why’s). From then on I shared I shared a lot about what was happening at LandlordMax, such as this artcile about such as this post from 2005 called LandlordMax Property Management Software Status Update. As of this moment I have personally posted 160 articles about LandlordMax on my blog FollowSteph.com. This includes a lot of details about how and why the software is designed, how it works, about how the company is doing, and everything else related to LandlordMax. If you really want to get a feel for the company this was the best place to get information other than our company email newsletter.
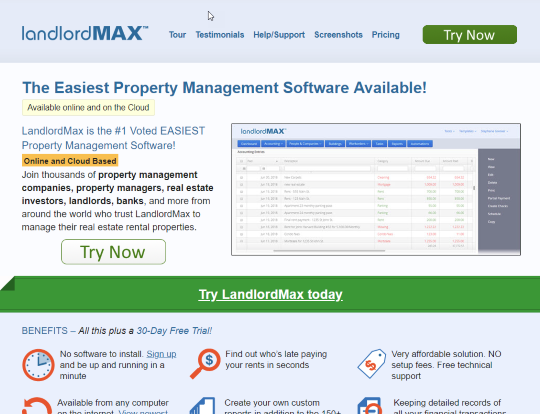
And today we’re now at the above screenshot. We’ve actually just done some significant updates to the website earlier this week for the new Cloud Edition so the above screenshot is very new. That being said this overall design was released around 2010 even though it’s had a lot of updates over the years. This design has been really nice and has been working great for us. What I find amazing is good it looks today considering how fast the web changes.
Software
Now onto the software, and has it ever changed over the last 15 years! Again keep in mind that the company released it’s first version around the time that Windows XP had just come out and Windows 98 was still the dominant computer system. In fact people were rebelling against Windows XP at the time and wanted to stay with Windows 98. The iPhone was still about 4 years from being released! Google had just been created 5 years before. At the time the tv shows Friends, Frasier, and Sex in the City were some of the more popular shows. The last two Matrix movies were released and George Bush was president of the United-States. The dot com crash was just a few years before and the 2008 financial crash (and real estate crash) where half a decade away. A different time.
For those of you who are technical (otherwise skip this paragraph and the next paragraph), and since the software is primarily written in Java, back then Java 1.4 had just been released and was considered brand new. Most people were still using Java 1.2 or Java 1.3, adoption of Java 1.4 was only for the more advanced companies. In fact the very first version of LandlordMax was mainly written in Java 1.3 and upgraded to Java 1.4 just before it’s release. Java 5 which includes Generics wasn’t available for at least another year. Java Swing was pretty new and we were featured in Sun’s Java Swing Sightings volume 19 for using Java Swing to create such a powerful desktop application. At the time the main web framework was Struts 1. Hibernate was brand new and barely wet behind the ears. The Spring framework had just been released and was also barely known. Git didn’t exist, in fact Subversion was the new kid on the block taking CVS by storm. Eclipse was also the new IDE and it was considered amazing compared to the competition. Intellij was also brand new and barely known. In fact if I remember correctly the big IDE back then against Eclipse was Borland’s JBuiler. I also seem to remember something about Visual Cafe but it’s been a long time. Either way initially LandlordMax was written with Eclipse using Java 1.3. I’m sure I’m making some mistakes on the details but it’s been 15 years.
In terms of computer hardware the P3 and P4 were the main computer processors. Most computers had less than 512Mb in RAM, 128Mb and 256Mb were closer to the norm. That’s less than 0.5Gb of today’s RAM. This limitation lead to a lot of design decisions in the early versions of the software.
And most importantly the computer screen sizes were a LOT smaller back then, there was no such thing as high definition tv’s. In 2003 at least 40% of users had screen resolutions of 800×600, meaning that the software had to support that screensize. Compare that to today’s 1080p screens with resolutions of 1920×1080. It’s about a quarter of the size! In fact even up until about 2008 most monitors still had resolutions below 1024×768. It’s only been maybe 5 years that lower resolutions monitors didn’t account for at least 10% of all users. Therefore the software was designed so that it could work on smaller screens. We’re not just talking laptops, but many people up until the early 2010’s still had computer monitors that had very low resolutions, meaning the software needed to fit on those monitors.
Moving on past the hardware limitations the first version of the software didn’t include the ability to store landlords. The number of reports was also limited to about 50 reports. Even with all that it still did a very good job and sold very and gained a strong following right out of the gate. It was easy to use compared to our competitors, at that time I remember some still being DOS based! In fact many people have been using LandlordMax for over a decade which is awesome!
I wish I had the release notes from the first two versions but unfortunately they have been lost to history. That being said we have all the release notes from version 1.08 to the last of the Installed Editions being version 11.05q, and including the new Cloud Edition. The version numbering was changed over the years, and although I don’t remember the exact details, at the end it was based on the number of years since it’s released followed by the month it was released. The letter after the numbers was the update count, meaning update 1 was a, update 2 was b, and so on.
If you’re interested in a very early version of the user manual to compare to today you can view the user manual from a very early version at the WayBack Machine here. Unfortunately it’s not from the first version because it includes a section about landlords but it still gives a good idea of what the early versions looked like. Interestingly if you look at the System Requirements section it only asks for a PII computer with 128Mb of RAM to run with an 800×600 monitor and 100mb of disk space. Although the software needs more than that today it’s still very much streamlined due to it’s history.
Over the years we’ve had 7 major releases of the Installed Editions of the software as well as the new Cloud Edition which just came out this year, giving us a total of 8 major releases. Version 6.05 was out for 5 years but actually included a major release within it but we decided to release it as a minor update to make it easier for our customers, so really 9 major versions even though it’s technically 8 official new major version.
On a side note as we go up in versions the number of updates increases. This is NOT because there are more fixes but rather because as we go up versions the landscape is changing quicker and many updates are needed to deal with these continuous changes. This can range from things like code signing certificates for version 11.05m to dealing with issues from misbehaving antivirus software and so on. These did happen back in the early to mid 2000’s but not nearly as often as they need to happen today.
Version 1.00, 1.02, and 1.08
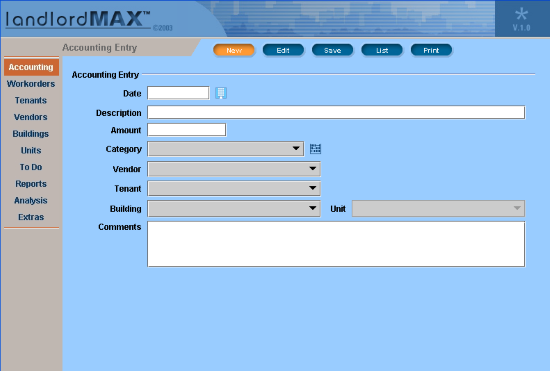
Skipping ahead to version 1.08 (version 1.02 added landlords and other things) the accounting system was completely redone to include the concepts of Date Paid and Amount Paid. Prior to that you could only enter in when the payment was paid or received. If the rent hadn’t been paid then you would still enter in an Accounting Entry with an empty Date and Amount (just Date and Amount rather than Date Paid and Amount Paid). With version 1.08 we also added other accounting functionality such as payment types (cash, check, etc.) rather than having to use the Description fields, as well as adding new types of reports. We added the Late fee button with this release. And this is when we passed 100 reports (today it’s virtually infinite because you can create your own custom reports).
Version 1.08 also introduced Data Filters, that is the ability to limit the data on the screen to specific types of data. So for example you could limit the accounting table to only rents from this month, or just limit the accounting table to just show rents, and so on. In the current version (Cloud Edition) you can limit the data to almost anything you want because you can enter in the header of each column what to filter the column on for every table. Getting back to version 1.08, QIF file support was introduced (since then a lot has changed in this regard but that’s a story for another day). Priority statuses were added for workorders and todo’s (now called Tasks).
Just to take a step back, and for those of you who are programmers I know this isn’t the best measure of complexity but it’s nonetheless the best one we have at this time, that the size of the program has almost doubled with version 1.08. The initial version 1.00 of LandlordMax was a total of 51,386 lines of code. If you assume 40 lines per page in a book then that’s a total of 1,285 pages. By version 1.08 it’s at 87,755, or 2,194 pages of programming code, almost a doubling in size. Version 11.05q was at just under 350,000 lines, or about 8,750 pages to give you an idea of how much it’s increased over time. We’ve added a lot of features over the years!
Version 2.12
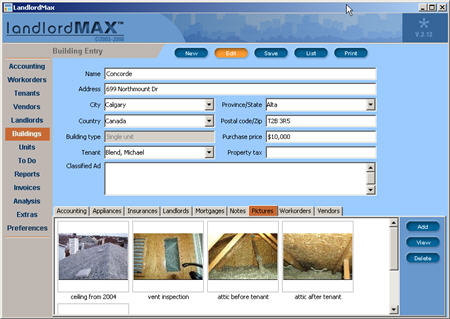
Next came version 2.12, and this was a big growth point for us. This is when the MVP (Minimal Viable Product) really started to hit it’s stride. Version 2.12 not only included major new features but it also included major internal changes. The biggest of which was that we changed the internal database system which served us very well for many years right up to the release of the Cloud Edition. This might seem like a minor change but it was a massive effort on our side.
In terms of features we added sorting on all tables. We added the ability to store pictures. We added the ability to setup a letterhead for all the printouts and reports along with some other report options. We also again added a number of new reports. I remember the Rent roll report being a major new report because of it’s complexity. It was very complex to get program, so much so that I wrote a blog post about it on my personal blog about all the efforts we went through to optimize it and make it performant. This is 2006 where most people are running P3 and P4 computers with 256mb-512mb of RAM for everything (operating system, software, etc.) meaning that we don’t have that much memory to play meaning your code needs to be very efficient. From the blog post we improved a rent roll report that ran for 512 pages (that’s a LOT of rents, we’re talking over 20,000 units and tenants) from 14 minutes to 12 seconds on an average computer of that time, meaning that for most people (less than 20,000 rental units) it was virtually instantaneous.
We also greatly improved the performance of the software, specifically saving data and reporting. We’re talking at least 1-2 orders of magnitude faster! For systems of the time this was very significant. In fact it’s still significant today and those same code improvements are in today’s Cloud Edition!
And of course we added a number of smaller improvements such as a popup notification when a new version comes out. We added new fields on many screens, added default accounting categories, color codes (color coded categories, tenant statuses), etc.
Even the minor updates included improvements. For example version 2.12c included very significant performance improvements, especially for larger databases where we cut the startup time by about half. I remember that release we spent a LOT of time running JProfiler and analyzing the software and how to improve it. In fact we continued to do this even after the release as shown with the release of version 2.12d where we greatly improved the performance on how scheduled entries are calculated by making them 90% faster.
Version 3.11
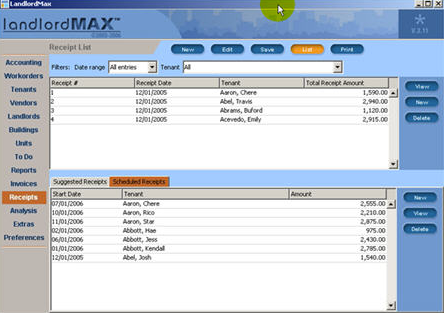
Version 3.11 was released in 2006 and fuelled a lot of our growth for the next few years. In fact it helped propel us through the 2008 financial meltdown because we were so well priced and offered a lot of value for the price. While many of our competitors closed during this period we continued to thrive and grow. It was a great time for the company.
If you look at the release notes for version 3.11 the first item you’ll see is that we again improved the performance of the software. This is again because we spent of a lot more time and effort analysing the software and it’s behavior and finding ways we could improve it. There’s always room for improvement in every software, some more than others (I won’t mention names but we’ve all experienced slow software), but our goal has always been to make sure the software runs as fast as possible on even the cheapest of entry level computers. This also includes improving the startup time. Version 3.11 was no exception and saw significant performance improvements all around.
In addition to all the performance gains we also added the ability to generate receipts directly in the software in addition to the existing invoices. The software now created scheduled entries based on the leases you entered whereas before scheduled entries always had to be manually created. We added the ability to select your date format preference (lots of demand for this). Supporting multiple date formats might seem small but it’s actually a very big effort because every date field in the software had to be altered, every date column in the tables had to be adjusted, every date in the reports had to be altered, and so on. Dates are everywhere in property management software! Moving on the late button was added to the accounting section to automatically create late fee entries based on the tenant’s lease information. We added filters to most of the other sections of the software whereas before I believe it was only the accounting section that had filters. All the reports were re-designed and updated to a more current style. We also added a number of additional smaller features such as the filters being saved automatically, we added new fields such as priorities on the workorders, and so on.
Shortly after releasing version 3.11 of LandlordMax Windows Vista was released, and so with version 3.11b we added Windows Vista support. I will say that supporting Windows Vista when it first came out was brutal due to the new UAC functionality of Windows. Thankfully Microsoft has adjusted how UAC works but early on it was extremely painful and many people and software companies complained about that feature, probably more so than any other new feature in Windows. I even wrote about our pains with UAC and Windows Vista on my personal blog. The short version is that Windows Vista would randomly and very suddenly change the database to read only, meaning that users suddenly could only read their data and not save or edit anything. This was extremely frustrating. Windows has since made a lot of changes to how UAC works and it’s no longer an issue, but was it ever problematic when it first came out. If you start Googling about UAC using negative keywords you’ll see a lot of interesting results come back from that era. In fact it became very common to turn it off entirely or run everything as an Admin user to just avoid it altogether defeating it’s whole purpose. Again thankfully it all resolved itself over time.
The biggest non-visible costs for us as a company was supporting Windows Vista. Not only was UAC challenging but the structure of how the software and where the database was located were all changed to support Windows Vista seamlessly, that is that the user didn’t have to do anything and it just worked. This might seem simple but a lot of things need to work together. For example the installer needs to know where things are installed depending on which version of Windows you’re running AND which version of LandlordMax you’re running, and it has to match all that with the software’s expectations. But the most complicated part is making sure updating from older to new versions works, meaning that the update system (installer) needs to not only check where the software use to be installed but also be able to access it and convert it to the new system. For us this included support for two different database systems, support for Windows 98, XP, and Vista, and so on.
All in all version 3.11 was a solid improvement in both features and performance.
Version 6.05 (pre-multiple Editions)
And then came version 6.05, our longest living version. Version 6.05 should’ve been broken up into two separate major versions with version 6.05e being a new major version but decided to keep it as a single version because we believed it would be a lot easier for people. Version 6.05e is when we created the different Editions (Desktop Edition, Soho Edition, Pro Edition, and Enterprise Edition). In other words in addition to upgrading versions some people wanted to upgrade Editions, and that can be confusing if you have to do both at the same time. By keeping it the same version (version 6.05) people could just upgrade Editions without first having to upgrade versions. It might seem like a small difference but we thought it was worth it based on feedback before the release. We lost revenues because of this but I still believe it was the right decision for both us and our customers.
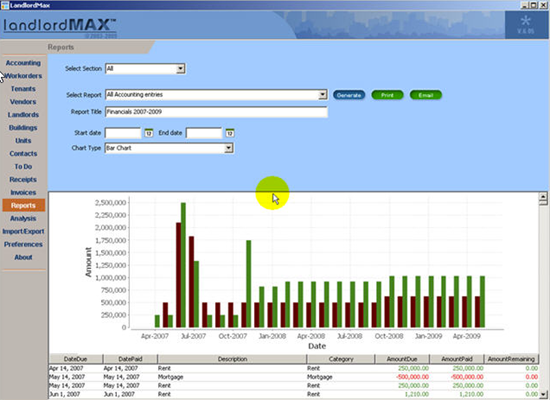
Now before I get to the Editions (version 6.05e), let’s look at the first releases of version 6.05. The biggest improvement is that we released a Mac version for 6.05b. The initial release of version 6.05 was Windows only but we released a Mac version for Snow Leopard shortly after the initial release. This was our entry in the Mac world!
Beyond Mac support the biggest feature improvement is that we added charting to the reports where you could select between 3 different types of charts where appropriate. Adding charts to reports really helped improved the value of the reports. We also completely revamped the scheduling system (scheduled accounting entries, etc.) to add Advance Notices so that the entries could appear ahead of time to both give people an advance notice as well as be able to more easily process early payments.
We added the ability to send emails to this release as well as Outlook integration. I will admit that Outlook integration was a great idea in theory but the reality was challenging because we always had to try to stay current with Outlook, meaning that sometimes we had to release updates when Outlook was updated. But more challenging was email support because so many antivirus software systems would incorrectly block LandlordMax that it was always a cat and mouse game of figuring out which antivirus software was incorrectly blocking the software and then trying to get the antivirus vendor to fix their software. Thankfully this is no longer an issue with the Cloud Edition, and it will never be an issue again, but with the installed Editions it was always going to be a cat and mouse game trying to get the antivirus software vendors to fix their software, and it was only getting worse each year. So much time and money has been spent due to bad antivirus software vendors, and it’s not just us, it’s becoming a big issue for most software that offer email support.
Anyways getting back to version we also added a number of other major features including a new Contacts section for any type of contact beyond tenants, vendors, and landlords, such as banks, realtors, etc. We added the ability to manage Accounts which can be anything from bank accounts to petty cash accounts. We added the ability to print multiple invoices and receipts in a single step. We added 20 new reports. We changed the menu system to make it more streamlined. Tenant comboboxes were completely overhauled so that current tenant’s appear first (alphabetically) then the different statuses one by one (also alphabetically by status). We added the ability to export reports. We further improved the performance of the rent roll reports. We added spellchecking. And a number of other features such as new workorder preferences, new fields, etc.
Version 6.05 was also the start of the code signing certificates. From this point on each release of the software is signed and certified to authenticate it’s been released by us for both Windows and Macs.
Just before we released the Editions we also started to offer both 32-bit and 64-bit versions of the LandlordMax. This may seem small but at the time it was very important to have both 32-bit and 64-bit offerings because 64-bit systems were starting to become popular and people wanted to take advantage of their bew 64-bit systems. These days almost every new computer is 64-bit but there are still a few 32-bit systems so we kept the 32-bit support.
Version 6.05e (Multiple Editions)
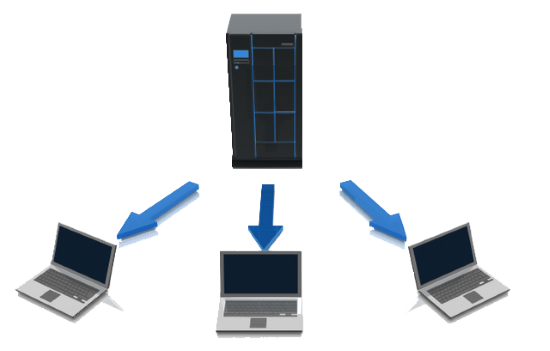
As I’ve said before version 6.05e should really have been a new major version of the software but we decided to release it as a minor update to reduce the confusion for those people who wanted to upgrade Editions. The different Editions basically fell into two different categories. The first being the Desktop Edition which is for one user on one computer, in essence the same as the previous versions. What was new was the Network Editions which were Editions where you could have multiple people working together on the same database through a client/server system over your company network or over the internet. You could even host the software on different cloud services such as Amazon’s cloud services.
I’ll just take a minute to say that the Network Editions were a MAJOR effort. It was our biggest effort up until the recent Cloud Edition by a pretty large margin. We basically had to re-write large portions of the software to be able to support multiple users working together in real time. Over the years we received a lot of questions why the Soho Edition (for 2 users) cost more than two Desktop Editions, and this is because they are completely different systems and have completely different costs. It’s a lot more complex to support two people on the same system than it is to support two people each on their own system. For example you have to do what are called concurrency checks on everything. So for example if you want to save or update a tenant you need to make sure that someone else in the background hasn’t made a save on that same tenant with your knowing. Or put another way what happens if two people open up the same record and both try to save at the same time what happens? You don’t want the second person to overwrite the work of the first because if they do then no one will know this happened. Merging is also not possible because what happens if they edit the same field in the same entry but in different ways – for example they both edit the comment field? There’s all kinds of logic and checking that goes into a multi-user system. For those of you who are technical we use what’s called optimistic concurrency controls to do this.
In addition to adding concurrency controls we also had to add the ability to send the data over a network. For humans it’s simple to say just change tenant John Smith’s address to 123 Main street but for a computer it’s much more complicated. You need to setup a protocol. You could use an existing protocol such as xml but that’s not always efficient or performant, especially if you’re going to be sending a lot of data back and forth. All that also had to be developed.
And of course there is additional functionality that needs to be added such as users, that is user management, logging in, security checks, and so on. We also needed to have the ability to convert existing databases over to the new Network Editions. We needed to make sure it was very secure. We had to develop new installer options and new installer setups. All in all offering Network Editions was a massive effort.
And since we were going to be making such a massive changed we also decided to take advantage of it and add additional improvements. Since we were going to be in the internal guts of the system and changing it all we decided to spend more time analyzing it’s performance to see where we could further improve it. This is especially important if you’re transmitting data over what may be very slow connections such as a bad and slow wifi connection. And of course this resulted in even further performance improvements for ALL Editions. We also completely changed how pictures were saved within software to be much more performant. We added a new Management section which could be used for printing invoices, receipts, etc. We completely redesigned the workorder printout. And of course we again added a ton of smaller changes from new fields to you name it. We even added some smaller things such as support for Retina displays with version 6.05f for example.
Version 11.05
The next major version was version 11.05 which ended with version 11.05q. Version 11.05 increased the code base by 40% which is very significant. To give a comparison it increased the code base by more than all the code written for all versions up to version 3.11 combined just to give you an idea of scale!
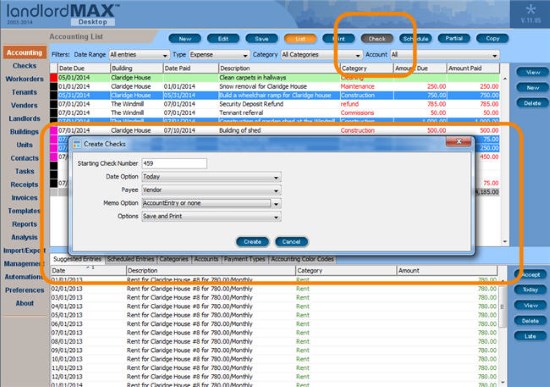
With that in mind the biggest improvements included the ability to select which columns you wanted to appear in the accounting table. An all new Checks sections was added with the ability to print checks. We added the ability to store documents with your data such as lease agreements. A whole new Automations section to allow you to run the same reports for all your clients (landlords) in one step (this was greatly improved upon in the Cloud Edition and also supports running the same reports for all your tenants in one step). We added things like scheduled maintenance, a “Today” button for suggested entries, copying of accounting entries, 20 new reports, the ability to print mailing labels, automated pro-rated rent calculations, lease renewal, Statuses for buildings and landlords, new Profit & Loss reports, support for commercial tenants, and new data filters. And of course we also added a ton of new minor features such as new fields, performance improvements, new date formats, new frequencies, and so on.
The biggest change with version 11.05 and the other versions is how often we had to update it. Most of the these updates were to support changes in Windows, Apple’s OS X, antivirus software issues, etc. Basically things outside of the software. For example at some point Apple decided to change it’s code signing certificate. Then Windows also did the same. We also released several updates just because we needed to upgrade internal systems to work around misbehaving antivirus software systems, due to Windows/Apple updates, etc, even though we didn’t always explicitly state it. Whenever we had to do one of these updates we always included other fixes if there were any, even if they were very minor. For example version 11.05k was one of the few times we explicitly stated it because of how much it effected some users (it was specifically to deal with an issue with McAfee’s antivirus software). Version 11.05m was to upgrade our code signing certificate on Windows. Version 11.05i was to update the software for the latest version of MS Word and Outlook as well as fixes to errant antivirus software systems by upgrading the installer software.
In essence about half of our time supporting version 11.05 was dealing with issues due to things outside of the software such as misbehaving antivirus software systems, updates required by other systems, etc. And this has only been increasing with time. For example most antivirus software systems these days are much more prone to block software for just about anything, especially if your sends out emails, and they require you to contact them to resolve the issue. As you can imagine this is very annoying and time consuming (and expensive) because each has a different way to contact and submit issues for false positives, and different vendors can take different amounts of time to respond, and more importantly resolve the issue. And some just don’t respond at all. And you need to do this for every single release, including every single minor updates. So much so that it’s become counter-productive and is very challenging. We were seeing dips of as much as 30%-50% in revenues for the first 2-3 weeks after every update due to the software being incorrectly blocked by antivirus software combined with the time it takes to have the antivirus software vendors resolve their issues. This makes it very challenging to release frequently. The most common issue being the software being blocked from sending emails.
Cloud Edition
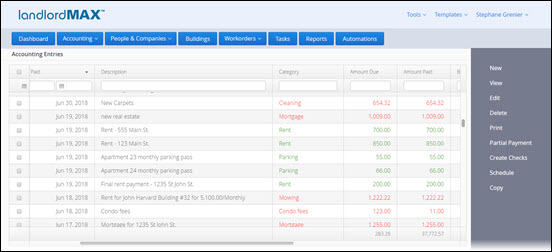
Which leads us to this year in which we released the online and web based Cloud Edition of LandlordMax. Initially it was by private invite to existing customers but it’s now publicly available. Existing customers can of course transfer their databases from the previous Installed Editions. We started developing this Edition at least a few years ago and it’s now our biggest release yet by a large margin. We’ve been able to leverage a lot of the code from the Installed Editions but it also required a lot of new code. After all it’s web based which means all the screens are going to be different because they use different technologies. Also the database engine is different, not to mention the database schema. Not only that but since we were having to redo a lot of the software we took advantage of this and rebuilt certain systems from the ground up. For example the reporting system has been completely redesigned. You can now create your own custom reports!! You can also customize the reports that come with the software! This is something we had been wanting to offer for a long time and it’s now available. And that’s just to name a few of the new features, the full release notes can be found here.
Some of the new features include the ability to edit entries directly in the tables without having to go into the entry itself. This is especially useful if you want to make quick edits and/or don’t want to lose your place in the table.
All the screens have been revised since they had to re-built because the software uses web based technologies rather desktop technologies. We added a built-in word processor so that you can create your own documents within the system. We completely re-did the Automations section so that it now lets you select which report you want to run for all your tenants or landlords with specific criteria (for example all tenants, only current tenants, etc.), including any custom reports you created. Some reports such as the Profit & Loss report have been completely redesigned, not just the screen itself but what data and how the data is presented. We added the ability for you to define the system templates, that is how invoices, receipts, workorders, etc. are printed.
We also added a number of additional new features to help improve the software. And in fact we’ve already added a number of features since it’s initial release, including a new system template to print individual accounting entries all the way to a new Building status of Inactive, and so on.
Today and the Future
Over the last few years there has been a big shift in demand from installed software to web based cloud services. In fact the demand for this has been increasing exponentially. LandlordMax is no exception. We started to see demand as far back as 5 years ago, but it really started to be noticeable about 3 years ago. That’s when we took the decision to start creating the Cloud Edition. Then about 2 years ago the demand for a web based cloud offering was bigger than for installed software. A year ago it was clear that web based cloud services were the way of the future, the demand was incredible and growing each month. The demand for web based software had blasted past the demand for installed software by that point. Today it’s not even comparable.
The analogy I like to give is Netflix vs Blockbuster where within about 3 years Blockbuster went from being the giant of the two to being closing their stores. The market demand shifted that quickly. The same thing is happening with web based cloud services but quicker. We needed to adapt and adapt we did.
Right out of the gate the demand for our Cloud Edition has been incredible!! It’s been better than we expected. We’re extremely happy with the release. We expected demand for the Installed Editions (Desktop Edition, Soho Edition, Pro Edition) to transition to the Cloud Edition but we could never have predicted just how much it shifted. This isn’t to say they weren’t great products, they were, but the time has come where the demand has shifted. Just like Blockbuster use to be a great way to rent videos, after all VHS takes and then later DVD’s and Blue-rays were the best option until internet speeds were fast enough to allow on demand video streaming, at which point demand for streaming media exploded. Today the same is true with web based cloud services. Their time has come and the demand has clearly shifted. Since the release of our Cloud Edition we’ve confirm the decision was very much the right decision, the shift in demand for the Cloud Edition is very clear.
With that in mind I’m sad to say we are discontinuing the Installed Editions, including the Desktop Edition, the Soho Edition, and the Pro Edition in favour of the Cloud Edition. Our customers have clearly spoken and we’re listening. There will always be some people who prefer installed software, just like there will always be some people who prefer to rent physical DVD’s, but compared to the number of people who prefer Netflix it’s not even comparable, and so we have to adjusted based on the demand. As such the Cloud Edition is going to become our de facto Edition, meaning that we will only be offering the Cloud Edition from this point on. The other Editions will be removed from the website completely by the end of this month. We will of course offer the ability to convert your existing database to the Cloud Edition from the Installed Editions (Desktop Edition, Soho Edition, and Pro Edition).
We also expect to be significantly improve the Cloud Edition on an ongoing basis. For example one of the major features in the pipeline include custom user management, that is you can create your own types of users with different access levels. We’re also looking at creating departments for user management. Another major feature we’re looking to add is the ability to create templated documents such as lease templates which will be automatically populated based on your data. We also want to greatly improve the dashboard page by offering you the ability to select which “Widgets” you want to include, where widgets are different components such as say a list of rents due or late rents, perhaps a specific report, and so on. Basically different “Widgets” you can pick and choose to include in your dashboard screen so that it’s customized to your needs and preferences.
And that’s just to name a few of the new major features we want to add. I’m not even going to start to mention all the medium to small level features we want to add because we have a lot of new features in the pipeline!! One of the big benefits with the Cloud Edition is that we can release them as they are ready, meaning you don’t have to wait for a major version to benefit from new features!
The future has always been positive for us here at LandlordMax and I believe it’s looking the best it’s ever have right now with the release of the new Cloud Edition. I can’t wait to write about our 20 year anniversary in 5 years! We’re one of the oldest property management software companies on the market, which says a lot because we’ve not only survived through the financial crisis and real estate crash of 2008, but thrived due to it. Here’s to many more years!!

